How to Read Your Own Lab Panel
A1c, fasting insulin, ALT, and a lipid panel tell most of the story about metabolic health. Here is what each number means before your clinician explains it.
Medically reviewed by Dr. Adaeze Nwosu, MD
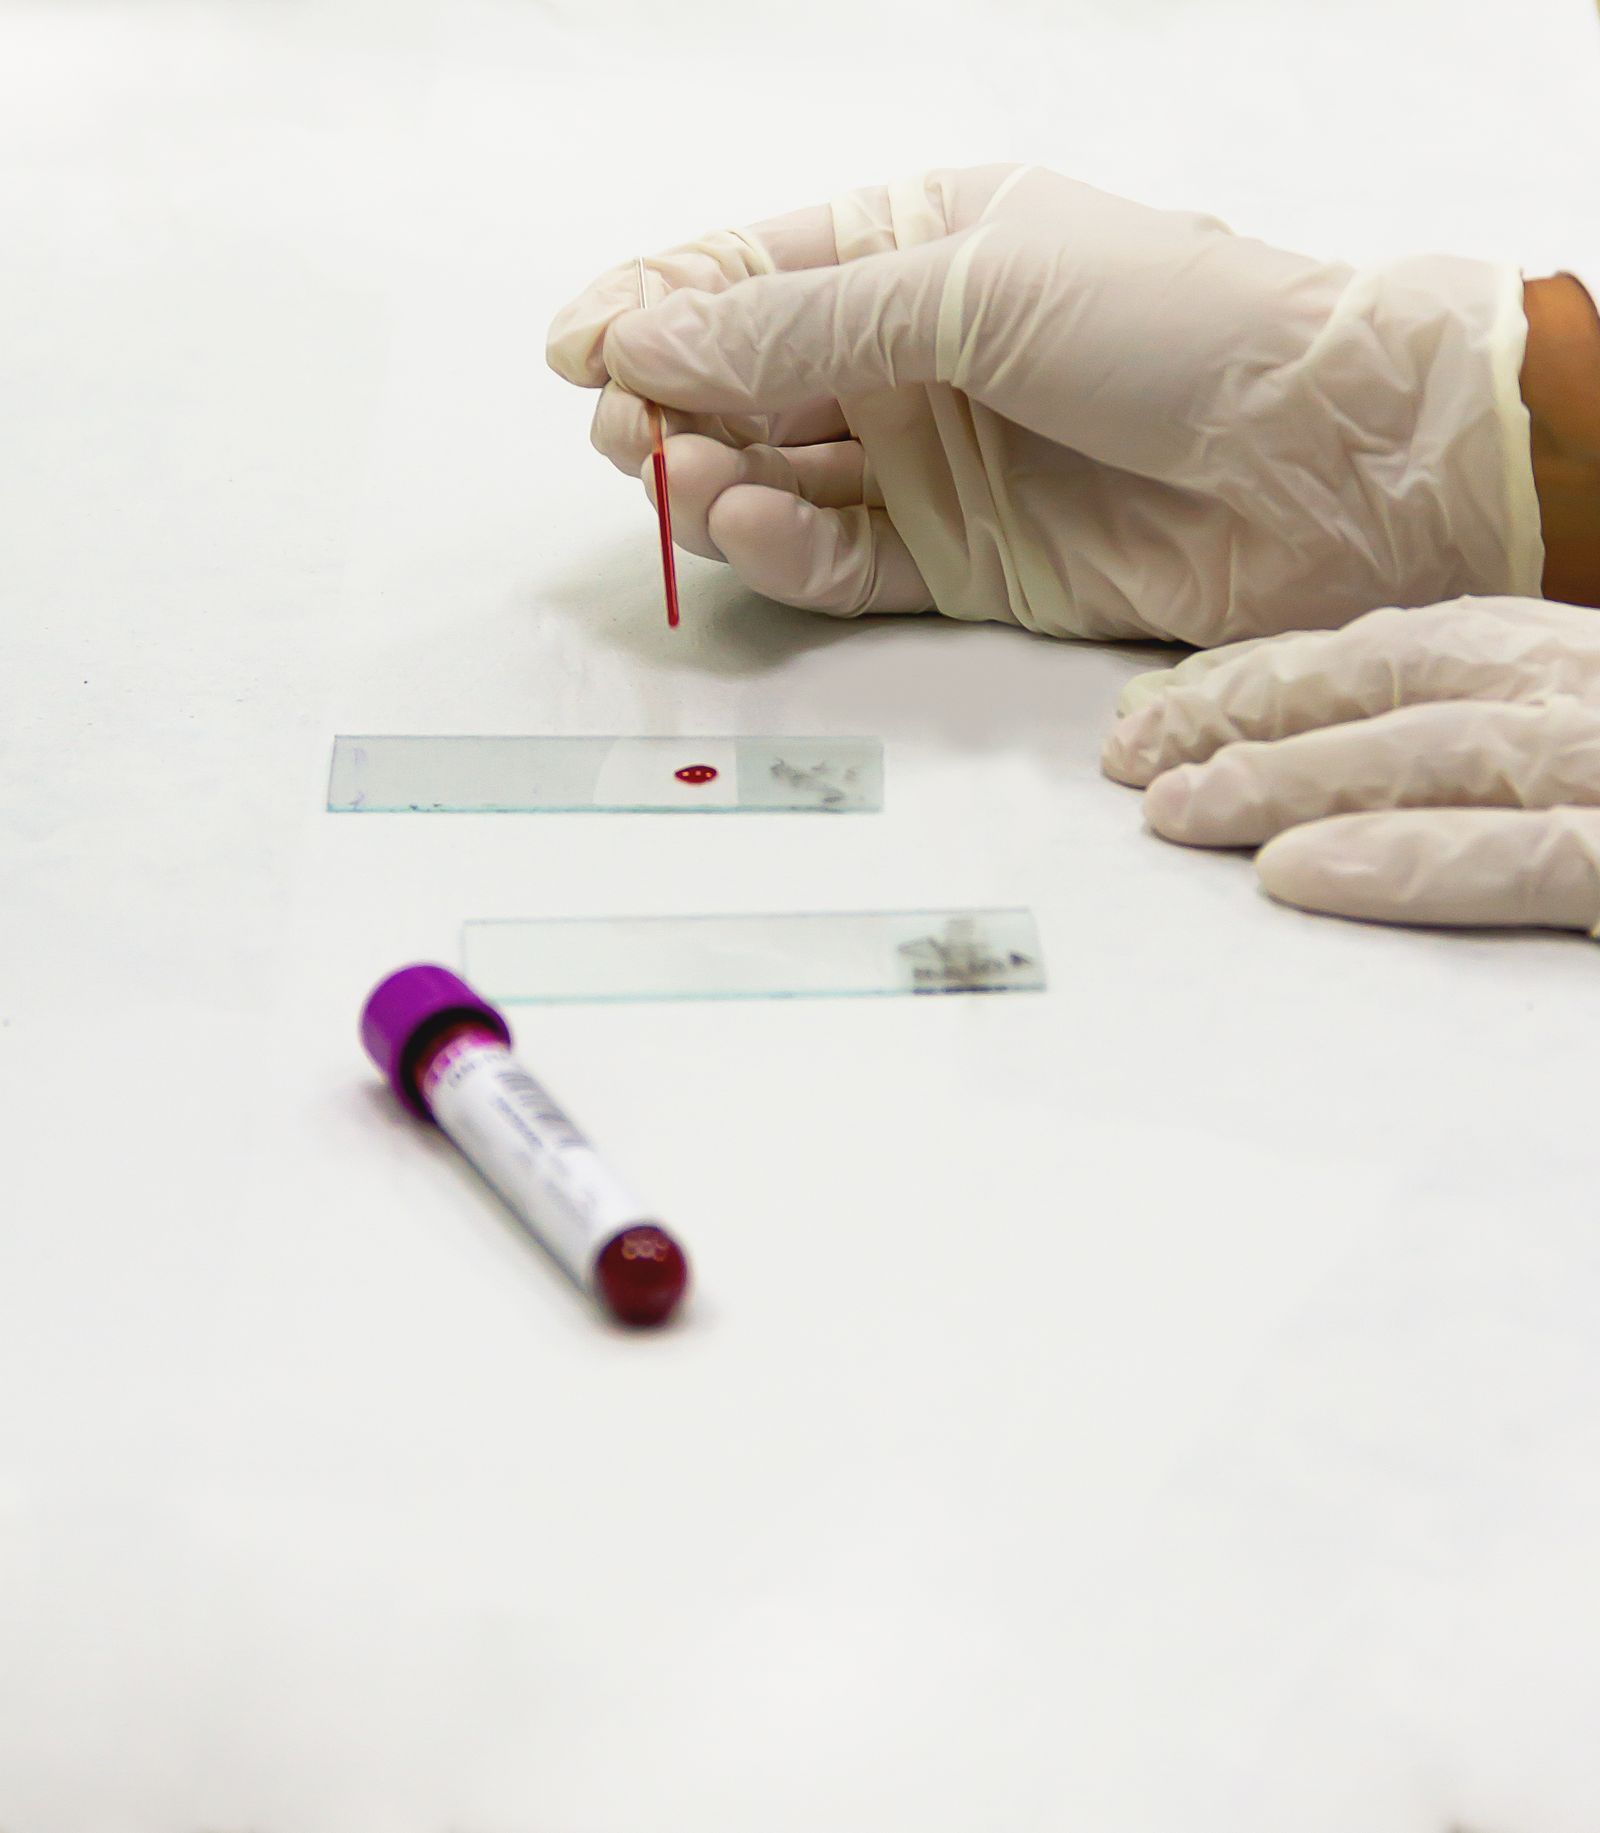
Lab results arrive as a wall of abbreviations with a reference range beside each one. Being inside the reference range is not the same as being optimal, and knowing the difference changes how you read your own results.
Hemoglobin A1c
A three-month average of your blood sugar. Below 5.7% is normal, 5.7 to 6.4% is prediabetes, and 6.5% or above indicates diabetes. Movement within the normal range still matters, since 5.6% and 5.0% are meaningfully different metabolic positions.
Fasting insulin
Frequently the earliest signal, and frequently not ordered. Insulin resistance can be developing for years while A1c stays normal, because rising insulin is holding blood sugar down. A fasting insulin above roughly 10 uIU/mL is worth a conversation.
The lipid panel
- Triglycerides respond faster to diet change than any other lipid marker.
- HDL tends to rise with consistent activity.
- The triglyceride to HDL ratio is a useful shorthand for insulin resistance.
- LDL matters for cardiovascular risk, though context and particle size complicate it.
ALT and liver markers
A mildly elevated ALT in someone carrying excess weight often points to fat accumulation in the liver. It is common, frequently reversible, and one of the markers that responds well to weight loss.
Every Voltameds member gets a full panel before starting and again at twelve weeks, so these numbers become a trend line rather than a snapshot.
This article is for general information and is not medical advice. Talk to a licensed clinician about your own situation before starting or stopping any medication.